What can users do?
Users can create, view, and download data from CHORDS. However a person’s access level will determine the functions available. Permissions, such as data downloader, are enhancements on a registered user, while the guest user is equivalent to not being logged in.
Guest
Guest User Can:
- Read About page
- View self information
Registered User
Registered User Can:
- Read About page and view data
- View Site
- View Instruments
- Can View and edit self information
Data Downloader
You guessed it. This option lets Users view and download data from instruments.
A Data Downloader can:
- Download data
- View Instruments, (only if combined with Registered user)
- Log into chords
- Click on “Data” on the left side of your screen
- Select the dates that you want to download data from
-
Select the instruments you want to download data from OR click “Select All”
- Click “Download GeoJSON” or “Download GeoCSV”
Measurement Creator
Measurement Creator can:
- Create test data
- Create test measurements
As a measurement creator it is recommended that you keep this account separate from other accounts that are used for data downloading or just as a registered user. Doing so prevents security issues in the future. Each Measurement user has their own API key to send measurements.
To find your api key:
- Log into chords with your measurement account
- Click on “Users” on the upper right corner of the screen
- Copy the randomly generated key under API key.
You should only have ONE API key per instrument.
Particle IoT hardware
How to create a JSON string using Particle
- In the beginning of your program add the line:
#define ARDUINOJSON_ENABLE_ARDUINO_STRING 1 - Add the library ArduinoJSON
#include <ArduinoJson.h> - In Loop initialize the JSON, Add variables to the JSON, Publish the JSON as a string
the items that say leaf.<something> are pulling data from sensors.
//Pull Sensor data to variables
float sm6      = moisture_percentage_sm6;       // shallow soil moisture sensor: percent of raw
float sm18     = moisture_percentage_sm18;      // deep soil moisture sensor: percent of raw
float st6      = soil_temperature;              // shallow soil temp (C)

//JSON string creation
jsondata["bme_temp"] = temp;
jsondata["bme_rh"] = rh_humid;
jsondata["bme_pressure"] = pressure;

// Format string for submission to CHORDS
String data = String::format(
  "{"
    "\"sm6\":%.2f,"
    "\"sm18\":%.2f,"
    "\"st6\":%.2f,"
  "}",
  sm6,
  sm18,
  st6);

// Created a new variable named data that is of type string which is needed for particle publish
  Particle.publish("MoonFarm", data, PRIVATE);
  delay(60000);
For this next step make sure you have the following from your CHORDS portal
instrument id number
API Key (Under users)
URL (selecting “Data URLs” and then everything up to the “?”)
- Log into your Particle Cloud Console
- On the left hand side select “Integrations” then “New Integration”
- Click “Webhook”
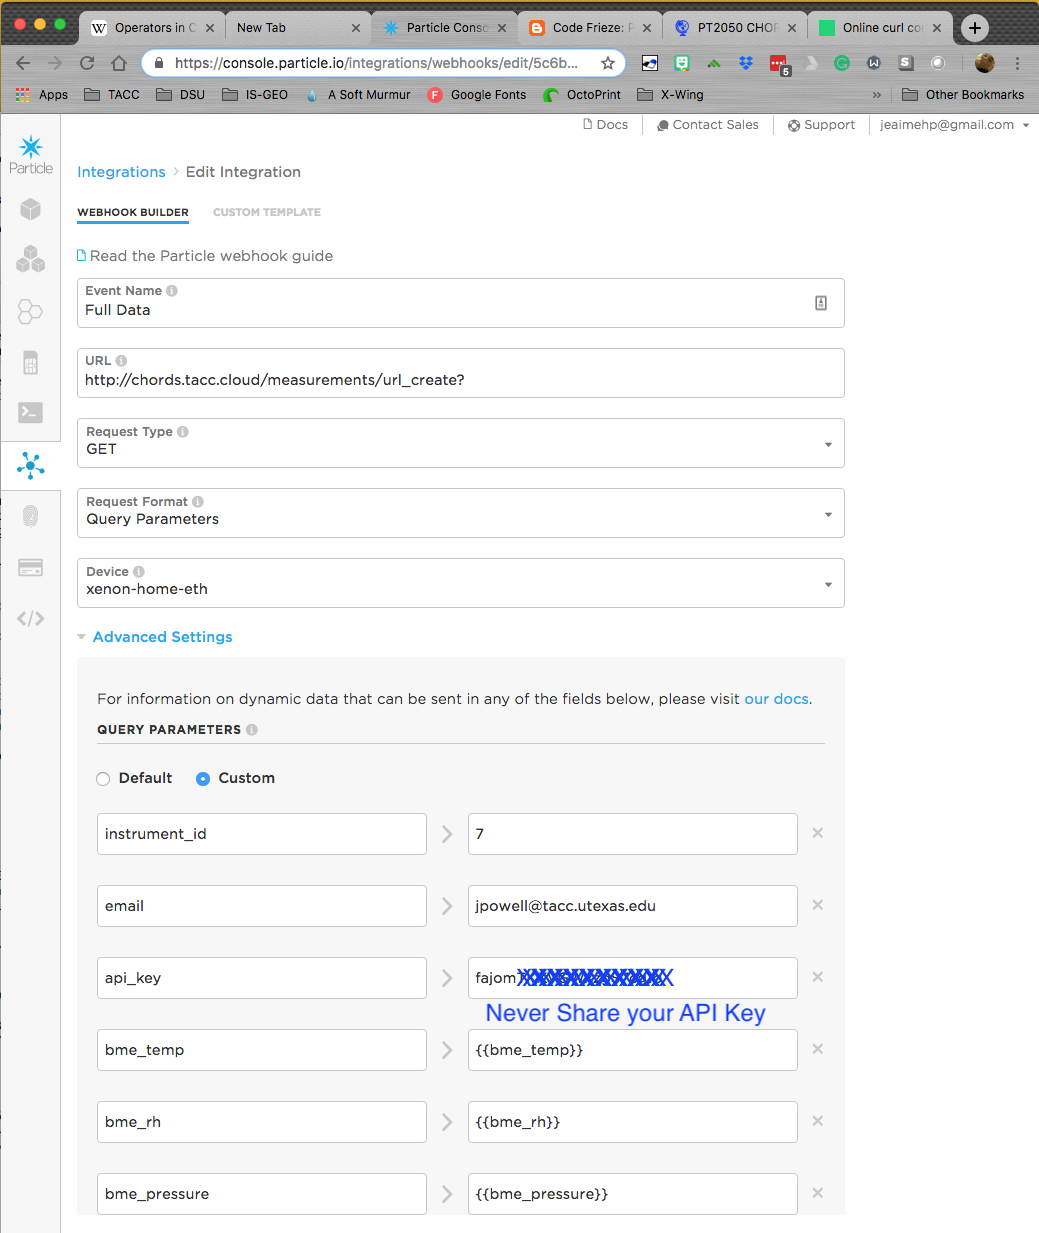
- For event name type in the name of the Particle Publish event Title (eg. if your code has Particle.publish(“Full Data”, datum); then the event name would be “Data”)
- For the URL paste in the URL from “DataURLs” found in CHORDS up to and including the “?”
- For Request Type select “GET”
- For Device, select the appropriate device or leave it as any depending on the project
- Click “Advanced Settings”
- Under “Form Fields” select “Custom”
- In the first two fields type “instrument_id” and the number of your instrument id from CHORDS
- Click “Add Row”
- In the rows first field type the “short_name” from your CHORDS and in the second field enter the “JSON Key Name” within a set of two braces (eg. )
Chords Short Name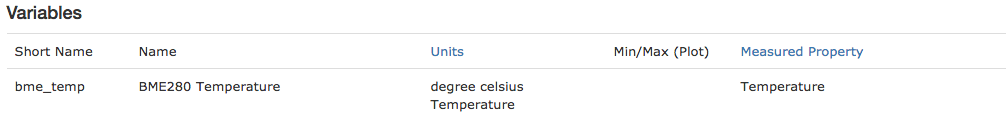 JSON Key Name

short_name from CHORDS and the JSON key name should MATCH.
- Continue to add rows for all of your variables
- Click “Create Webhook”
Do not Particle.publish data faster than 1 per second or Particle will complain and or limit your ability to stream data (you can insert a “delay(1000);” in your code after a Particle.publish to prevent this issue)
If the data never shows up at the CHORDS site you are using, you can go back to “Integrations” on Particle, scroll all the way down to the bottom of your webhook and it provides further information under “Logs”.
Thanks to Je’aime Powell of the University of Texas for putting together these documents for us.
Retrieving Data
Sending a URL from UNIX
Data In
It is easy to submit new data to a Portal, simply using standard HTTP URLs. The URL can be submitted directly from the address bar of your browser (but of course this would get tedious). We will first describe the URL syntax, and follow this with examples that demonstrate how easy it is to feed your data to a CHORDS Portal, using Python, C, a browser or the command line. These are only a few of the languages that work, and you should be able to figure out a similar method for your own particular language. Almost all programming languages have functions for submitting HTTP requests.
URL Syntax
Sample URLs for submitting measurements to the Portal:
http://myportal.org/measurements/url_create?instrument_id=[INST_ID]&wdir=038&wspd=3.2&at=2015-08-20T19:50:28
http://myportal.org/measurements/url_create?instrument_id=[INST_ID]&p=981.2&email=[USER_EMAIL]&api_key=[API_KEY]
http://myportal.org/measurements/url_create?instrument_id=[INST_ID]&p=981.2&email=[USER_EMAIL]&api_key=[API_KEY]&at=2015-08-20T19:50:28&test
myportal.org is the hostname of your Portal. The fields after “?” are qualifiers, each separated by “&”. Measurements for variables are specified by shortname=value pairs. You do not need to include measurements for all variables defined for the instrument, if they are not available.
| Qualifier | Optional | Meaning |
|---|---|---|
| instrument_id=id | No | The Portal assigned instrument identifier. |
| at=time | Yes | Specify a timestamp to be applied to the measurements. If at is not specified, the measurement will be stamped with the time that it was received by the Portal (often quite adequate). The time format is ISO8061. |
| email=[USER_EMAIL] | Yes | If the Portal has been configured to require a security key for incoming measurements, the user email, email qualifier is needed. |
| api_key=[API_KEY] | Yes | If the Portal has been configured to require a security key for incoming measurements, it is specified with the api_key qualifier. Keys are case sensitive and specific for a given user with the measurements permission enabled. |
| test | Yes | Add the test qualifier to signify that the measurements are to be marked as test values. Test measurements may be easily deleted using the Portal interface. |
Programming Examples
  wget http://chords.dyndns.org/measurements/url_create?instrument_id=25&wdir=121&wspd=21.4&wmax=25.3&tdry=14.3&rh=55&pres=985.3&raintot=0&batv=12.4&at=2015-08-20T19:50:28&email=[USER_EMAIL]&api_key=[API_KEY]

  curl http://chords.dyndns.org/measurements/url_create?instrument_id=25&wdir=121&wspd=21.4&wmax=25.3&tdry=14.3&rh=55&pres=985.3&raintot=0&batv=12.4&at=2015-08-20T19:50:28&email=[USER_EMAIL]&api_key=[API_KEY]
  #!/usr/bin/python

  #Put a collection of measurements into the portal
  import requests
  url = 'http://my-chords-portal.com/measurements/url_create?instrument_id=3&t=27.1&rh=55&p=983.1&ws=4.1&wd=213.5&email=[USER_EMAIL]&api_key=[API_KEY]'
  response = requests.get(url=url)
  print response
  ...
  <Response [200]>
  #include <stdio.h>
  #include <curl/curl.h>

  int main(void)
  {
    CURL *curl;
    CURLcode res;

    curl = curl_easy_init();
    if(curl) {
      // if using instrument_id:
      char* url = "http://chords.dyndns.org/measurements/url_create?instrument_id=25&wdir=121&wspd=21.4&wmax=25.3&tdry=14.3&rh=55&pres=985.3&raintot=0&batv=12.4&at=2015-08-20T19:50:28&email=[USER_EMAIL]&api_key=[API_KEY]";

      // if using sensor_id:
      char* url = "http://chords.dyndns.org/measurements/url_create?sensor_id=your_sensor_id&wdir=121&wspd=21.4&wmax=25.3&tdry=14.3&rh=55&pres=985.3&raintot=0&batv=12.4&at=2015-08-20T19:50:28&email=[USER_EMAIL]&api_key=[API_KEY]";

      curl_easy_setopt(curl, CURLOPT_URL, url);
      /* example.com is redirected, so we tell libcurl to follow redirection */
      curl_easy_setopt(curl, CURLOPT_FOLLOWLOCATION, 1L);

      /* Perform the request, res will get the return code */
      res = curl_easy_perform(curl);
      /* Check for errors */
      if(res != CURLE_OK)
        fprintf(stderr, "curl_easy_perform() failed: %s\n",
                curl_easy_strerror(res));

      /* always cleanup */
      curl_easy_cleanup(curl);
    }
    return 0;
  }
Data Out
It’s just as easy to get data out of a Portal as it is to put data in. This can be done directly from the Portal web page. Or you can use HTTP URL’s to fetch data. The URL can be submitted directly from the address bar of your browser, which will deliver the data in standard formats such as CSV files, JSON files, or plain JSON.
You can also retrieve data using your favorite programming language to construct a program to send URLs and receive data, letting you build analysis and visulaization apps that can process your real-time observations. Using JavaScipt, you can even build widgets and pages that display your data on your own web site.
We will first describe the URL syntax for retrieving data, and follow this with examples that demonstrate how easy it is to integrate your analysis activities with a CHORDS Portal using Python, HTML, IDL, Matlab, R, sh, etc. You get the idea.
URL Syntax
Sample URLs for fetching data from the Portal:
http://myportal.org/instruments/1.csv
http://myportal.org/instruments/1.csv?start=2015-08-01T00:30&end=2015-08-20T12:30
http://myportal.org/instruments/4.geojson?email=[USER_EMAIL]&api_key=[API_KEY]
http://myportal.org/instruments/3.xml
http://myportal.org/instruments/3.json?last
myportal.org is the hostname of your Portal. The fields after “?” are quallifiers, each separated by “&”.
The number following “instruments/” is the instrument identifier.
Following the instrument identifier is the format that the data will be returned in (csv, geojson, json or xml).
Some formats result in a data file being returned to you browser, which can be saved in a directory. The other formats directly return text, which can be easily ingested into programs.
| Format | File or Text | Data Product |
|---|---|---|
| .csv | File | Data in a comma-separated-value GeoCSV (CSV) file. CSV files can be opened automatically by spreadsheet programs such as MS Excel. |
| .geojson | File | Data in a GeoJSON structured file, following RFC 7946. Most scripting programs can easily read JSON into a structured variable. |
| .xml | File | Data in an eXtensible-Markup-Language (XML) structured file. |
| .json | Text | Data in straight JSON format. This format is used to bring data directly into a processing program. |
Fields after “?” are quallifier pairs, with each separated by “&”. The qualifiers are optional, and are used to refine the data request.
If time qualifiers are not specified, data for the curent day are returned.
| Qualifier | Meaning |
|---|---|
| start=time | Start time of the data span, in ISO8061 format. |
| end=time | Start time of the data span, in ISO8061 format. |
| email=[USER_EMAIL] | If the Portal has been configured to require a security key for downloading data, the user email must also be specified with the email qualifier. |
| api_key=[API_KEY] | If the Portal has been configured to require a security key for downloading data, it is specified with the api_key qualifier. Keys are case sensitive and must be paired with the user email associated with the api key. |
Data Backup
There are many ways to backup your data and configuration on your CHORDS portal. First you should note that when you run python3 chords_control --config a backup copy of your configuration files is created.
You can also manually back up your portal by saving your configuration and database once everything is set up.
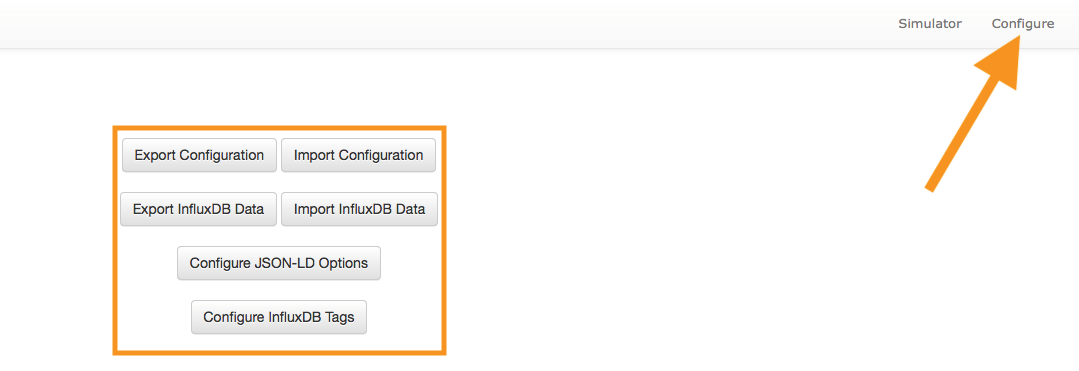
To save Configuration:
- Go to Configuration tab
- Click on Export Configuration
To save Influxdb data:
- Go to Configuration tab
- Click on either Export Influxdb data
You can also upload previous information from an old portal to a new one by using the Import buttons located at the top of the configuration page.
Download Data
To download data first go to the Data tab in your CHORDS portal. From here you can download data 4 different ways.
- You can download data within a determined date range.
- You can download data by selecting specific instruments and then clicking “Download GeoJSON”
- You can download all of your data by clicking “Select All” and then clicking “Download GeoJSON”
- You can select “Data URLs” then select the generated url. Combine this with custom code to continue to pull specific data types.
Grafana
Beginning Grafana
How to make alerts on Grafana (Provided by Virginia Tech)
Grafana is an open-source visualization system that allows you to create powerful data dashboards, right from the browser. The dashboards are very responsive because they fetch data directly from the CHORDS database. The extensive Grafana documentation explains how to unleash the full capability of the system.
However, the following tutorial explains quickly how to configure Grafana to interact with CHORDS, and how to create a simple dashboard.
Note: You should have the portal configured with at least one site/instrument/variable before trying to create a dashboard. If there is no data in the portal, you can create some test data using the simulation function.
Extra credit: once you have been able to make a simple Grafana graph, see this tutorial for indepth instructions on database access and calculations.
This is an example of Grafana panel embedding. The iframe element is:
<iframe src="http://portal.chordsrt.com:3000/d-solo/000000015/5-ml-sonic?refresh=1m&orgId=1&panelId=1&from=now-1h&to=now" width="800" height="600" frameborder="0"></iframe>
-
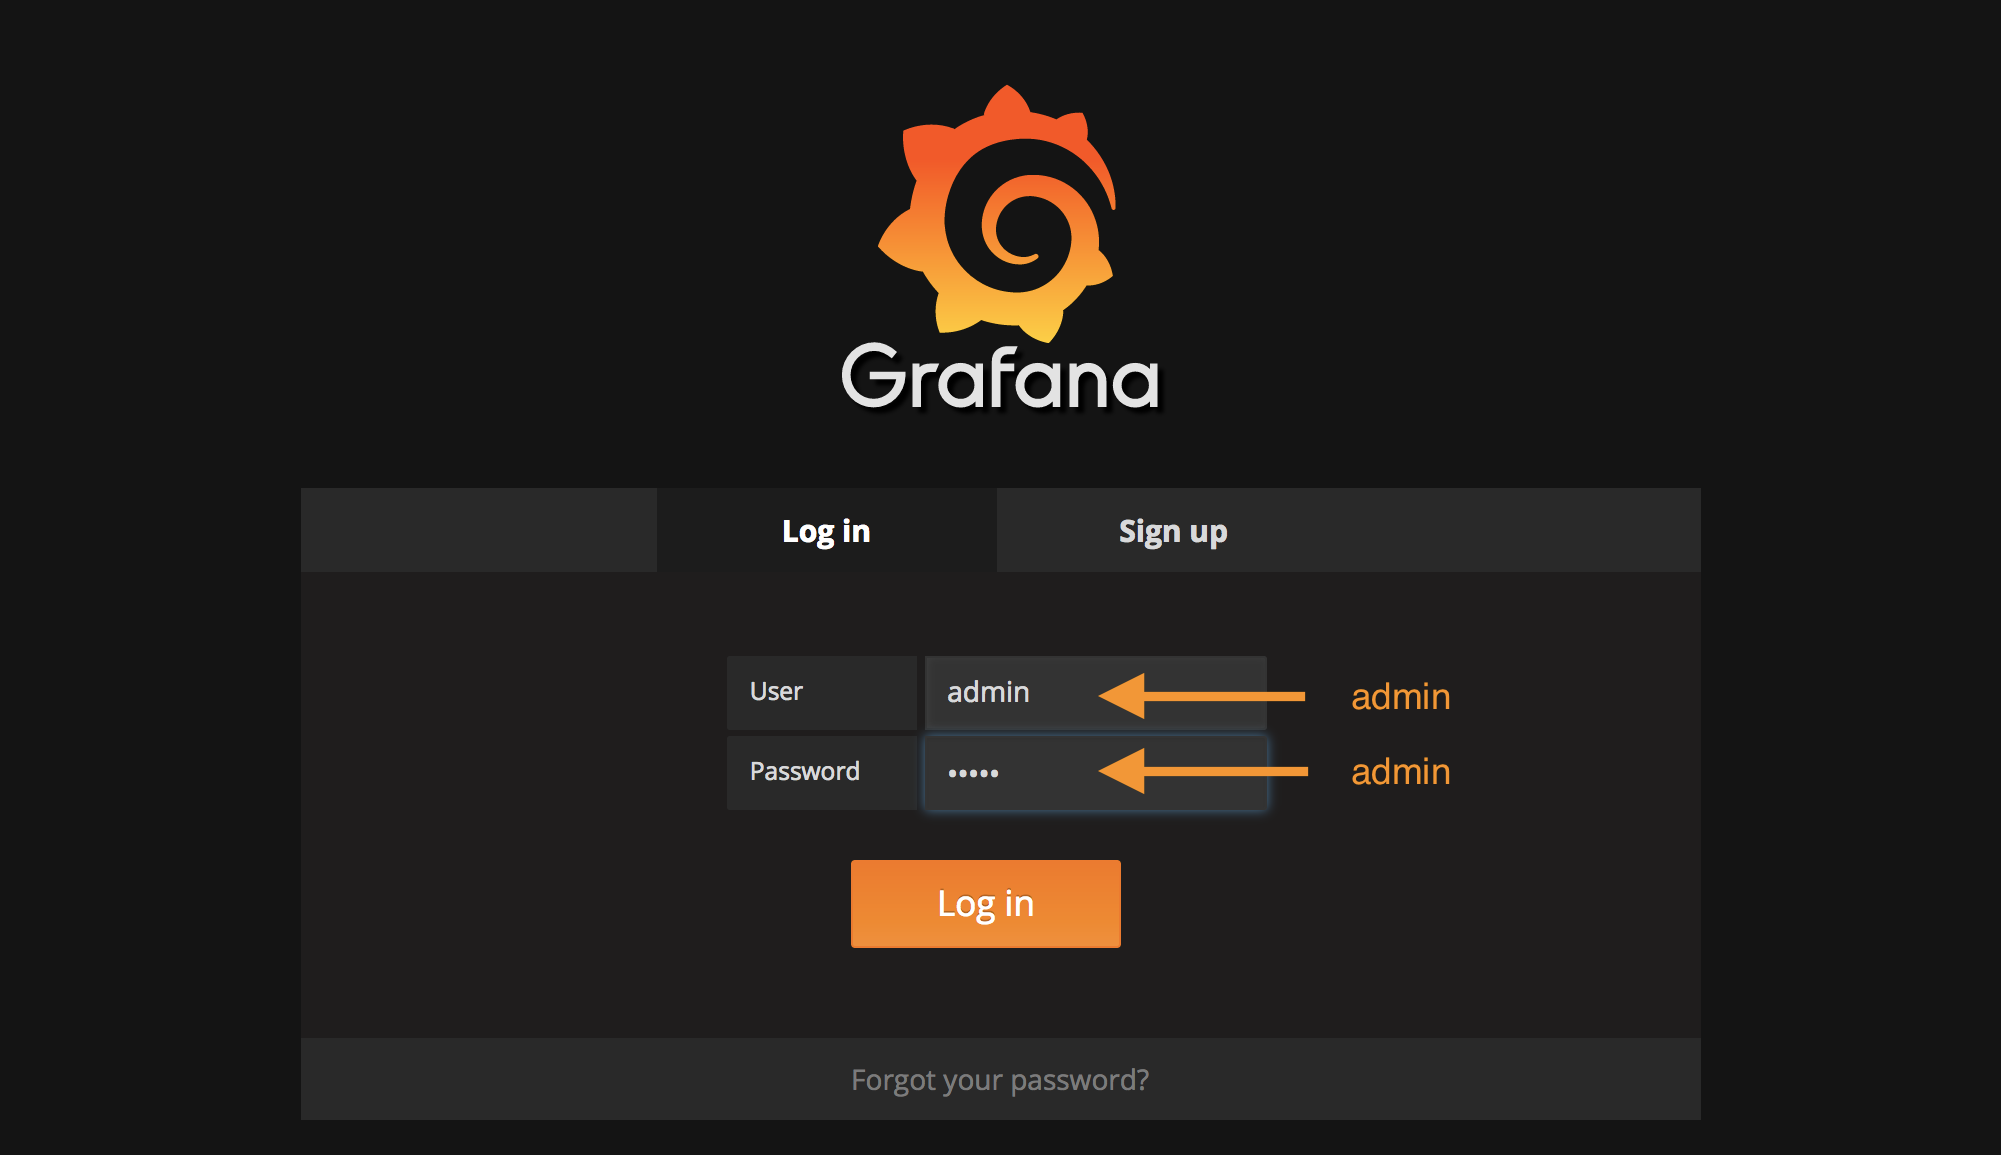
Open Grafana The visualization link will open a new browser window which provides access to the Grafana time-series visualization system.

- Login
- Sign in to Grafana
- Once you’ve signed in you will be required to change your password.
-
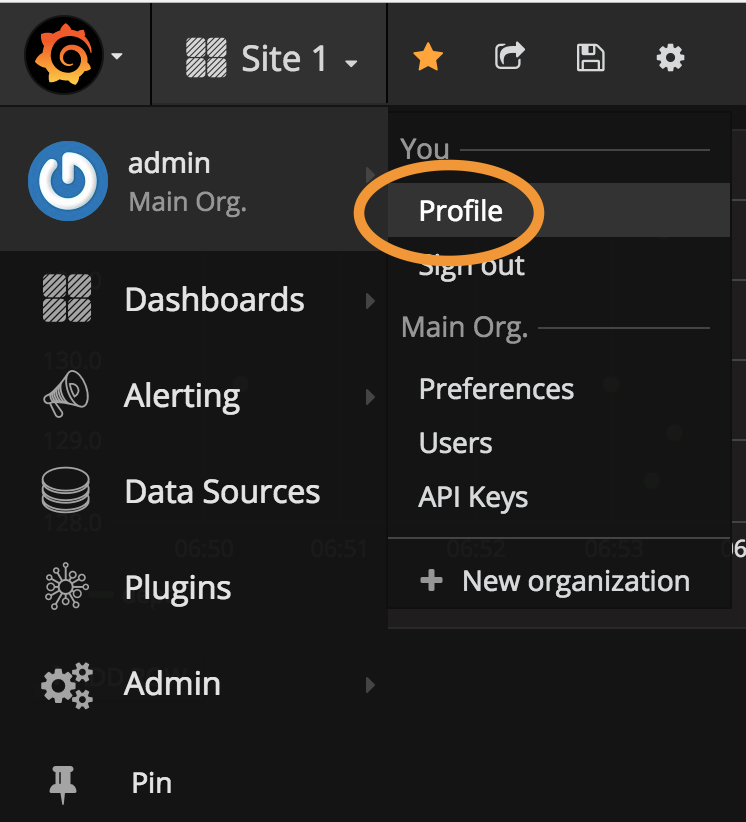
If you need to change your password again or edit permissions go through Admin->Profile:
- Add a new panel to a dashboard
- Your grafana is already set up with a dashport but you can set up different panels to suit your needs.
- Click on the “add a new panel” button in the upper middle part of the screen.
-
Select your desired panel
- Connect data to new panel
- Click on the title of the new panel and select “edit”
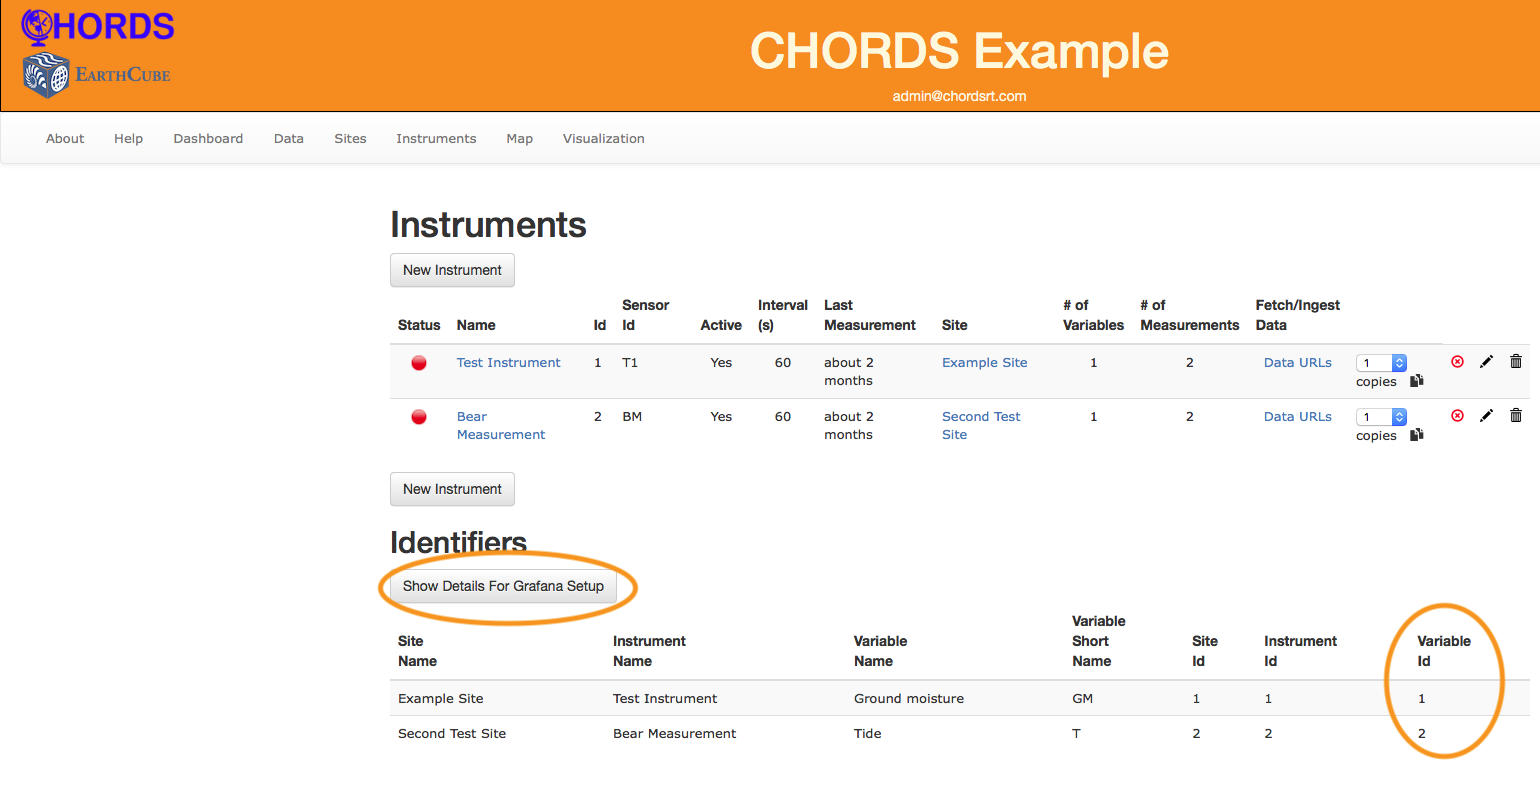
- Fill out the content
NOTE:The variable number will relate to the instrument_id NOT sensor_id. (var = instrument_id)
When you’re done editing your grafana should look something like:
“autogen” “tsdata” “var” “(variable number)”
“field(value)” “mean()”
“time($_interval)” “fill(null)”
“(enter legend)”